iSEE into genes: transcripts!
everyone
06/26/2021
transcripts.RmdQuantification of data from Alasoo et al. (2018) against GENCODE (Frankish, GENCODE-consoritum, and Flicek 2018) using Salmon (Patro et al. 2017).
library(macrophage)
dir <- system.file("extdata", package="macrophage")
coldata <- read.csv(file.path(dir, "coldata.csv"))
coldata <- coldata[,c(1,2,3,5)]
names(coldata) <- c("names","id","line","condition")
coldata$files <- file.path(dir, "quants", coldata$names, "quant.sf.gz")
all(file.exists(coldata$files))
## [1] TRUEWe load in the quantification data with tximeta:
library(dplyr)
coldata <- coldata %>% filter(condition %in% c("naive","IFNg"))
se <- tximeta(coldata, countsFromAbundance="scaledTPM", varReduce=TRUE)
library(DRIMSeq)
counts <- data.frame(gene_id=sapply(mcols(se)$gene_id, `[`, 1),
                     feature_id=mcols(se)$tx_name,
                     assays(se)[["counts"]])
samples <- as.data.frame(colData(se))
names(samples)[1] <- "sample_id"
d <- dmDSdata(counts=counts, samples=samples)
n <- 12
n.small <- 6
d <- dmFilter(d,
              min_samps_feature_expr=n.small, min_feature_expr=10,
              min_samps_feature_prop=n.small, min_feature_prop=0.1,
              min_samps_gene_expr=n, min_gene_expr=10)
d
## An object of class dmDSdata
## with 790 genes and 12 samples
## * data accessors: counts(), samples()
library(DEXSeq)
sample.data <- DRIMSeq::samples(d)
count.data <- round(as.matrix(counts(d)[,-c(1:2)]))
dxd <- DEXSeqDataSet(countData=count.data,
                     sampleData=sample.data,
                     design=~sample + exon + condition:exon,
                     featureID=counts(d)$feature_id,
                     groupID=counts(d)$gene_id)
# this takes a little over a minute on my laptop
system.time({
  dxd <- estimateSizeFactors(dxd)
  dxd <- estimateDispersions(dxd, quiet=TRUE)
  dxd <- testForDEU(dxd, reducedModel=~sample + exon)
})
## user system elapsed
## 21.551 5.083 17.832
dxr <- DEXSeqResults(dxd, independentFiltering=FALSE)
qval <- perGeneQValue(dxr)
dxr.g <- data.frame(gene=names(qval),qval)
columns <- c("featureID","groupID","pvalue")
dxr2 <- as.data.frame(dxr[,columns])
library(pheatmap)
pheatmap(log10(as.matrix(dxr[dxr$groupID == names(which.min(qval)),"countData"])+1),
         cluster_rows=FALSE, cluster_cols=FALSE, show_rownames=FALSE, show_colnames=FALSE)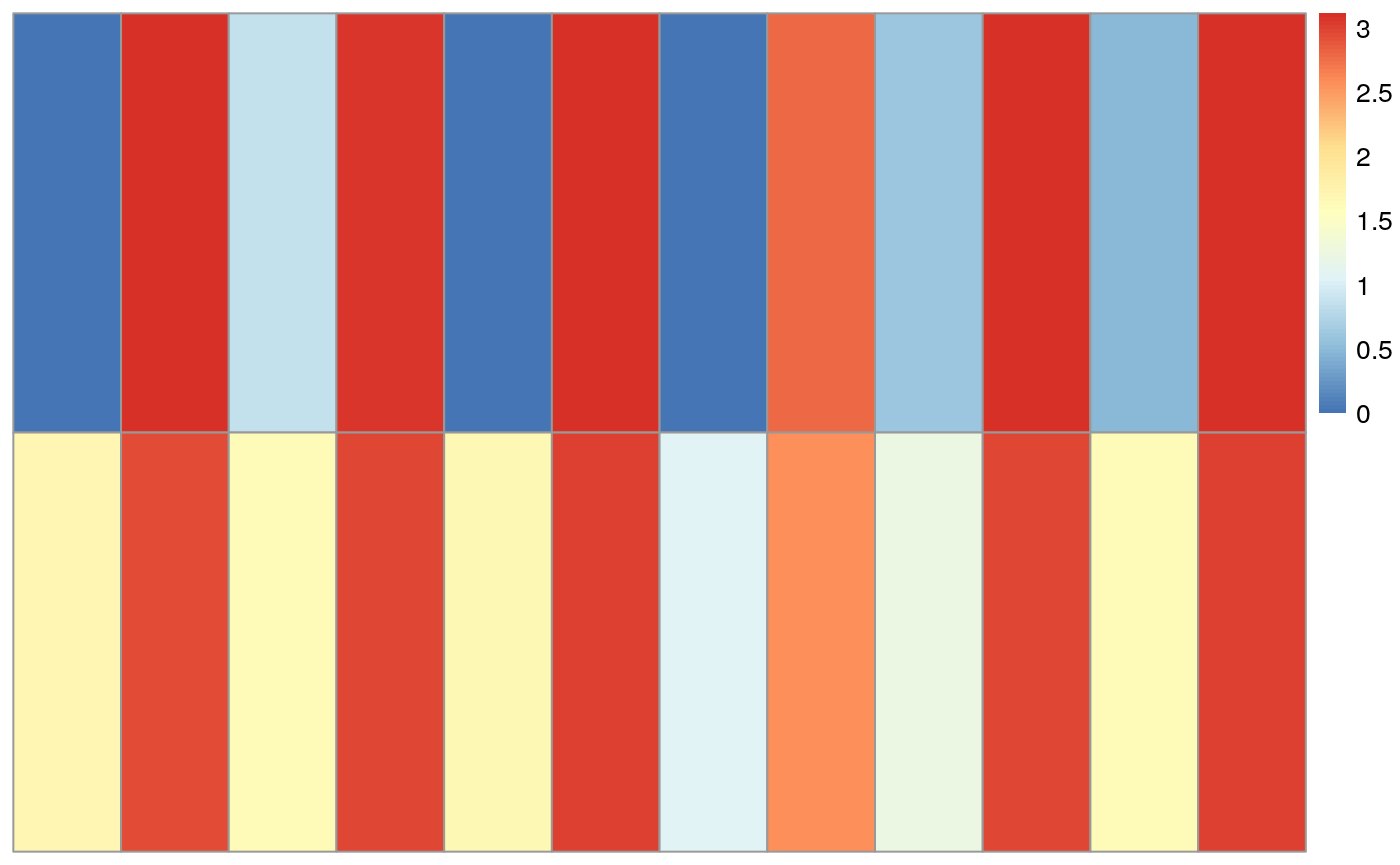
stageR for stagewise testing
library(stageR)
pConfirmation <- matrix(dxr$pvalue,ncol=1)
dimnames(pConfirmation) <- list(dxr$featureID,"transcript")
pScreen <- qval
names(pScreen) <- names(pScreen)
tx2gene <- as.data.frame(dxr[,c("featureID", "groupID")])
stageRObj <- stageRTx(pScreen=pScreen, pConfirmation=pConfirmation,
                      pScreenAdjusted=TRUE, tx2gene=tx2gene)
stageRObj <- stageWiseAdjustment(stageRObj, method="dtu", alpha=0.05)
dex.padj <- getAdjustedPValues(stageRObj, order=TRUE,
                               onlySignificantGenes=FALSE)
head(dex.padj, n=10)
## geneID txID gene transcript
## 1 ENSG00000225492.6 ENST00000513638.5 0.000000e+00 0.000000e+00
## 2 ENSG00000225492.6 ENST00000394662.2 0.000000e+00 0.000000e+00
## 3 ENSG00000228106.5 ENST00000442171.5 0.000000e+00 2.312812e-16
## 4 ENSG00000228106.5 ENST00000450784.5 0.000000e+00 1.000000e+00
## 5 ENSG00000228106.5 ENST00000441676.5 0.000000e+00 1.000000e+00
## 6 ENSG00000228106.5 ENST00000435378.5 0.000000e+00 1.000000e+00
## 7 ENSG00000228106.5 ENST00000457636.5 0.000000e+00 1.000000e+00
## 8 ENSG00000162923.15 ENST00000486652.5 4.616504e-09 1.851921e-10
## 9 ENSG00000162923.15 ENST00000414423.7 4.616504e-09 2.626296e-06
## 10 ENSG00000162923.15 ENST00000443112.6 4.616504e-09 1.000000e+00We talked about having the test statistics available within the RangedSummarizedExperiment prior to calling iSEE. For now, I will just add the DEXSeq + stageR adjusted p-values to the rowData.
se <- se[rownames(se) %in% dex.padj$txID,] # filter se based on DRIMSeq filtering? Do we want that as a general rule?
rowData(se)[,c("gene_padj", "tx_padj")] <- dex.padj[match(rownames(se),dex.padj$txID),c("gene", "transcript")]
Visualize raw usages as proportions
library(iSEE)

# Helper to compute proportions (based on DEXSeq's classes.R)
.getTotalCount <- function(countData, tx2gene) {
    geneForEachTx <- as.character(tx2gene$gene_id[match(rownames(countData), tx2gene$tx_name)])
    forCycle <- split(seq_len(nrow(countData)), as.character(geneForEachTx))
    all <- lapply(forCycle, function(i) {
        sct <- countData[i, , drop = FALSE]
        rs <- t(vapply(seq_len(nrow(sct)), function(r) colSums(sct[, , drop = FALSE]), numeric(ncol(countData))))
        # adapted, removed "-r" to get gene-level counts
        rownames(rs) <- rownames(sct)
        rs
    })
    totalCount <- do.call(rbind, all)
    totalCount <- totalCount[rownames(countData), ]
    return(totalCount)
}

# Main function, relies on iSEE::FeatureAssayPlot
ProportionsPlot <- function(se,
                            transcript,
                            XAxisColumnData,
                            PanelWidth=6L){

    totalCount <- .getTotalCount(countData = assays(se)$counts,
                                 tx2gene = rowData(se))
    assays(se)$proportions <- assays(se)$counts/totalCount

    # directly borrow FeatureAssayPlot from iSEE:
    init <- iSEE::FeatureAssayPlot(YAxisFeatureName=transcript,
                                   Assay="proportions",
                                   XAxis= "Column data",
                                   XAxisColumnData = XAxisColumnData,
                                   PanelWidth=6L)

    # !proportions assay only available in local function environment
    app <- iSEE(se, initial=list(init))
    return(app)
}
app <- ProportionsPlot(se = se,
                       transcript = "ENST00000486652.5",
                       XAxisColumnData = "condition",
                       PanelWidth=6L)
shiny::runApp(app)
Session information
## R version 4.1.0 (2021-05-18)
## Platform: x86_64-pc-linux-gnu (64-bit)
## Running under: Ubuntu 20.04.2 LTS
##
## Matrix products: default
## BLAS/LAPACK: /usr/lib/x86_64-linux-gnu/openblas-pthread/libopenblasp-r0.3.8.so
##
## locale:
##  [1] LC_CTYPE=en_US.UTF-8       LC_NUMERIC=C
##  [3] LC_TIME=en_US.UTF-8        LC_COLLATE=en_US.UTF-8
##  [5] LC_MONETARY=en_US.UTF-8    LC_MESSAGES=C
##  [7] LC_PAPER=en_US.UTF-8       LC_NAME=C
##  [9] LC_ADDRESS=C               LC_TELEPHONE=C
## [11] LC_MEASUREMENT=en_US.UTF-8 LC_IDENTIFICATION=C
##
## attached base packages:
## [1] stats4    stats     graphics  grDevices utils     datasets  methods
## [8] base
##
## other attached packages:
##  [1] iSEE_2.5.1                  SingleCellExperiment_1.15.1
##  [3] stageR_1.15.0               pheatmap_1.0.12
##  [5] DEXSeq_1.39.0               RColorBrewer_1.1-2
##  [7] DESeq2_1.33.1               BiocParallel_1.27.0
##  [9] DRIMSeq_1.21.0              GenomicFeatures_1.45.0
## [11] AnnotationDbi_1.55.1        dplyr_1.0.7
## [13] tximeta_1.11.2              SummarizedExperiment_1.23.1
## [15] Biobase_2.53.0              GenomicRanges_1.45.0
## [17] GenomeInfoDb_1.29.1         IRanges_2.27.0
## [19] S4Vectors_0.31.0            BiocGenerics_0.39.1
## [21] MatrixGenerics_1.5.0        matrixStats_0.59.0
## [23] macrophage_1.9.0
##
## loaded via a namespace (and not attached):
##   [1] circlize_0.4.13               AnnotationHub_3.1.3
##   [3] BiocFileCache_2.1.1           systemfonts_1.0.2
##   [5] igraph_1.2.6                  plyr_1.8.6
##   [7] lazyeval_0.2.2                shinydashboard_0.7.1
##   [9] splines_4.1.0                 ggplot2_3.3.4
##  [11] digest_0.6.27                 foreach_1.5.1
##  [13] ensembldb_2.17.0              htmltools_0.5.1.1
##  [15] fansi_0.5.0                   magrittr_2.0.1
##  [17] memoise_2.0.0                 cluster_2.1.2
##  [19] doParallel_1.0.16             limma_3.49.1
##  [21] ComplexHeatmap_2.9.0          Biostrings_2.61.1
##  [23] annotate_1.71.0               pkgdown_1.6.1.9001
##  [25] prettyunits_1.1.1             colorspace_2.0-2
##  [27] ggrepel_0.9.1                 blob_1.2.1
##  [29] rappdirs_0.3.3                textshaping_0.3.5
##  [31] xfun_0.24                     crayon_1.4.1
##  [33] RCurl_1.98-1.3                jsonlite_1.7.2
##  [35] tximport_1.21.0               genefilter_1.75.0
##  [37] iterators_1.0.13              survival_3.2-11
##  [39] glue_1.4.2                    gtable_0.3.0
##  [41] zlibbioc_1.39.0               XVector_0.33.0
##  [43] GetoptLong_1.0.5              DelayedArray_0.19.0
##  [45] shape_1.4.6                   scales_1.1.1
##  [47] DBI_1.1.1                     edgeR_3.35.0
##  [49] miniUI_0.1.1.1                Rcpp_1.0.6
##  [51] viridisLite_0.4.0             xtable_1.8-4
##  [53] progress_1.2.2                clue_0.3-59
##  [55] bit_4.0.4                     DT_0.18
##  [57] htmlwidgets_1.5.3             httr_1.4.2
##  [59] shinyAce_0.4.1                ellipsis_0.3.2
##  [61] pkgconfig_2.0.3               XML_3.99-0.6
##  [63] sass_0.4.0                    dbplyr_2.1.1
##  [65] locfit_1.5-9.4                utf8_1.2.1
##  [67] tidyselect_1.1.1              rlang_0.4.11
##  [69] reshape2_1.4.4                later_1.2.0
##  [71] munsell_0.5.0                 BiocVersion_3.14.0
##  [73] tools_4.1.0                   cachem_1.0.5
##  [75] generics_0.1.0                RSQLite_2.2.7
##  [77] rintrojs_0.3.0                evaluate_0.14
##  [79] stringr_1.4.0                 fastmap_1.1.0
##  [81] yaml_2.2.1                    ragg_1.1.3
##  [83] knitr_1.33                    bit64_4.0.5
##  [85] fs_1.5.0                      purrr_0.3.4
##  [87] KEGGREST_1.33.0               AnnotationFilter_1.17.0
##  [89] nlme_3.1-152                  mime_0.11
##  [91] xml2_1.3.2                    biomaRt_2.49.1
##  [93] compiler_4.1.0                filelock_1.0.2
##  [95] curl_4.3.2                    png_0.1-7
##  [97] interactiveDisplayBase_1.31.0 tibble_3.1.2
##  [99] statmod_1.4.36                geneplotter_1.71.0
## [101] bslib_0.2.5.1                 stringi_1.6.2
## [103] highr_0.9                     desc_1.3.0
## [105] lattice_0.20-44               ProtGenerics_1.25.0
## [107] Matrix_1.3-4                  shinyjs_2.0.0
## [109] vctrs_0.3.8                   pillar_1.6.1
## [111] lifecycle_1.0.0               BiocManager_1.30.16
## [113] GlobalOptions_0.1.2           jquerylib_0.1.4
## [115] bitops_1.0-7                  httpuv_1.6.1
## [117] rtracklayer_1.53.0            R6_2.5.0
## [119] BiocIO_1.3.0                  hwriter_1.3.2
## [121] promises_1.2.0.1              vipor_0.4.5
## [123] codetools_0.2-18              colourpicker_1.1.0
## [125] assertthat_0.2.1              rprojroot_2.0.2
## [127] rjson_0.2.20                  shinyWidgets_0.6.0
## [129] withr_2.4.2                   GenomicAlignments_1.29.0
## [131] Rsamtools_2.9.1               GenomeInfoDbData_1.2.6
## [133] mgcv_1.8-36                   parallel_4.1.0
## [135] hms_1.1.0                     grid_4.1.0
## [137] rmarkdown_2.9                 Cairo_1.5-12.2
## [139] shiny_1.6.0                   restfulr_0.0.13
References
Alasoo, K, J Rodrigues, S Mukhopadhyay, AJ Knights, AL Mann, K Kundu, HIPSCI-Consortium, C Hale, Dougan G, and DJ Gaffney. 2018. “Shared genetic effects on chromatin and gene expression indicate a role for enhancer priming in immune response.” Nature Genetics 50: 424–31. https://doi.org/10.1038/s41588-018-0046-7.
Frankish, A, GENCODE-consoritum, and P Flicek. 2018. “GENCODE reference annotation for the human and mouse genomes.” Nucleic Acids Research. https://doi.org/10.1093/nar/gky955.
Patro, R, G Duggal, MI Love, RA Irizarry, and C Kingsford. 2017. “Salmon Provides Fast and Bias-Aware Quantification of Transcript Expression.” Nature Methods 14: 417–19. https://doi.org/10.1038/nmeth.4197.